Analyzing your data shouldn't be complicated.
Lumalytics gives you real-time insights with agents and dashboards connected directly to your data sources. Simple, fast, and beautiful.
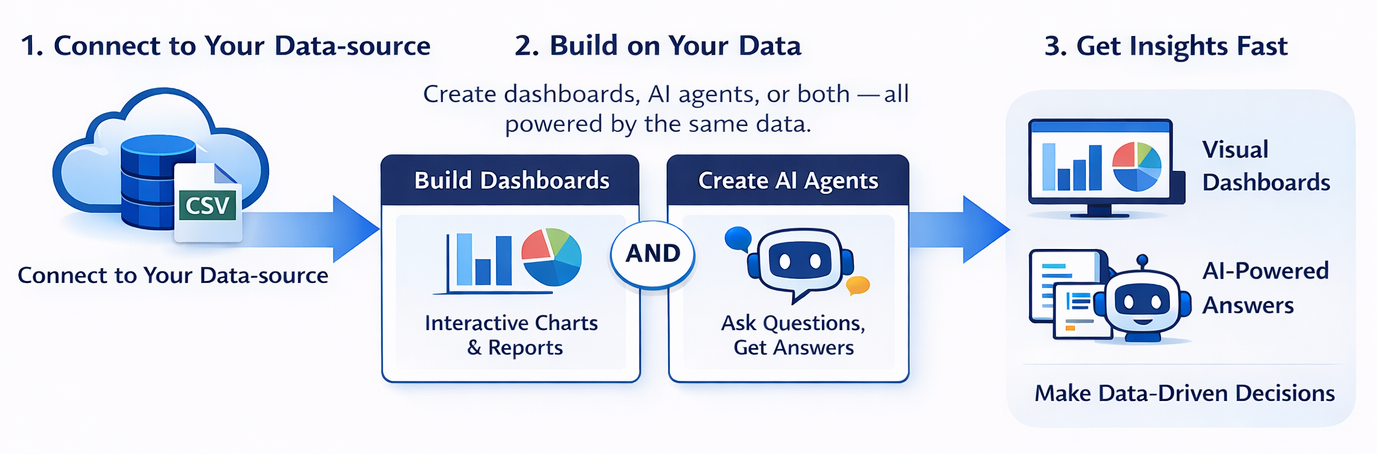
How it works
Features
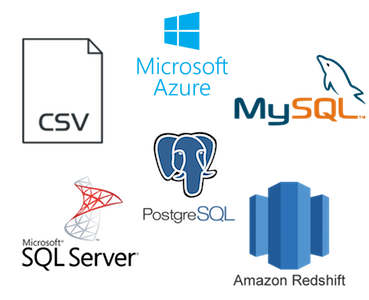
Pull data from various databases or csv files
We support connecting to Postgres, MySQL, SQL Server and Amazon Redshift. You can also upload your own CSV file. If you'd like us to support another data source, let us know. We're always looking to add more.
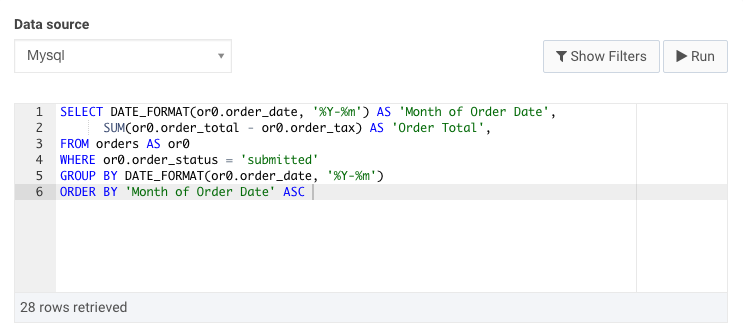
Use SQL to retrieve the data you want to display
You can write SQL queries to pull in exactly the data you want and then choose how you want to display it. We even allow you to write queries for uploaded CSV files.
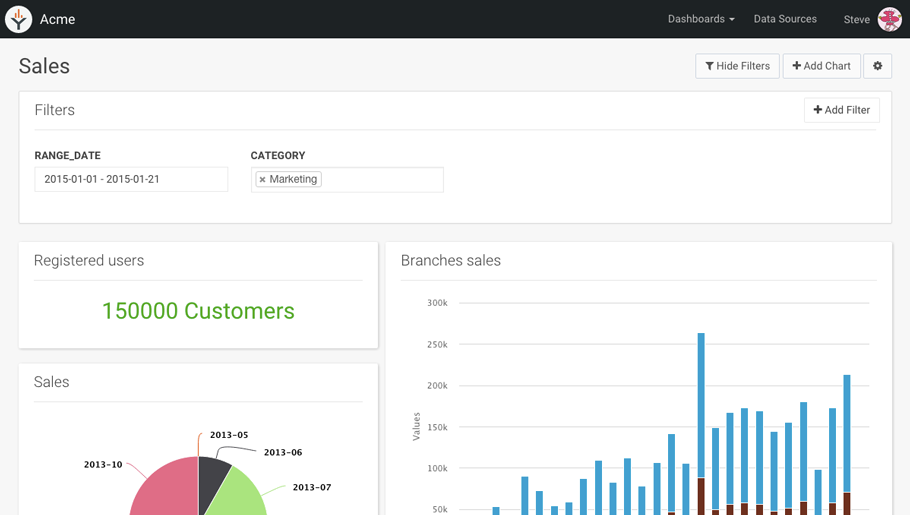
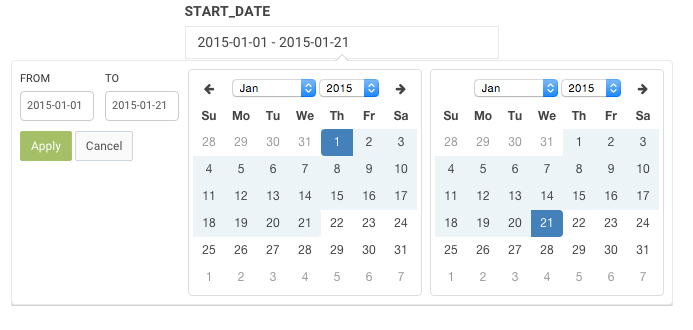
Add filters to build interactive dashboards
For dashboards to be useful, they need to be interactive. Sometimes you only want to show a chart for specific dates or a specific dropdown. No worries; we've got you covered. You can add filters (e.g. date range, category dropdown) that allow you to do this.
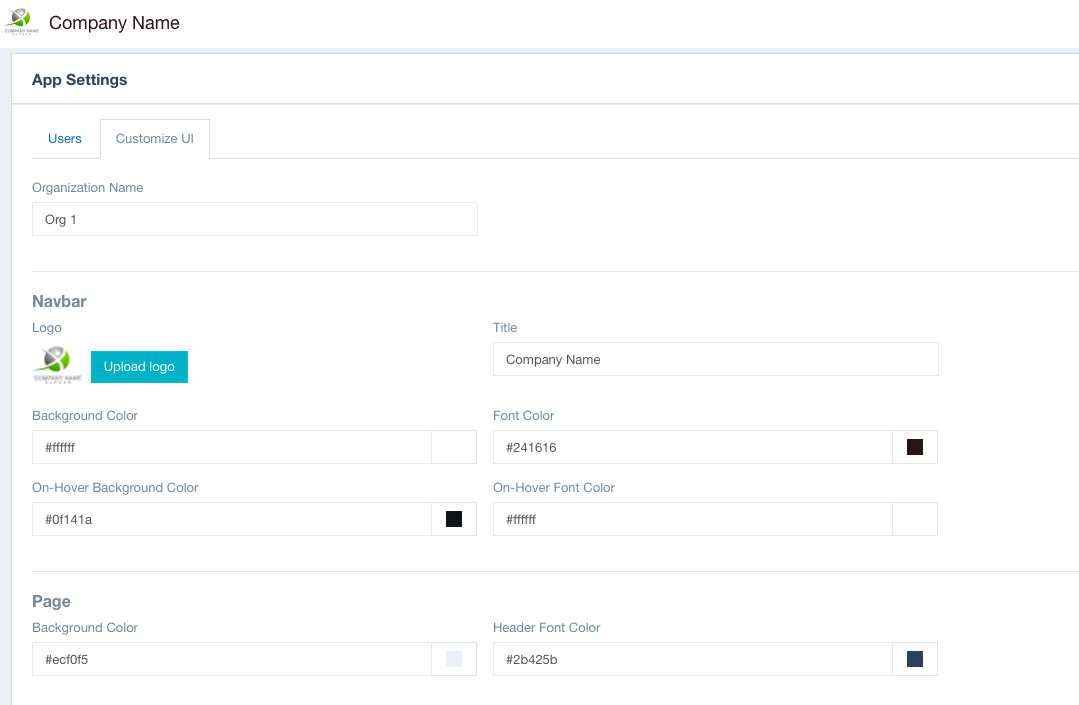
Customize the look and feel of your dashboards
You can define a custom color scheme, company logo and other content to ensure your dashboards look exactly how you want.
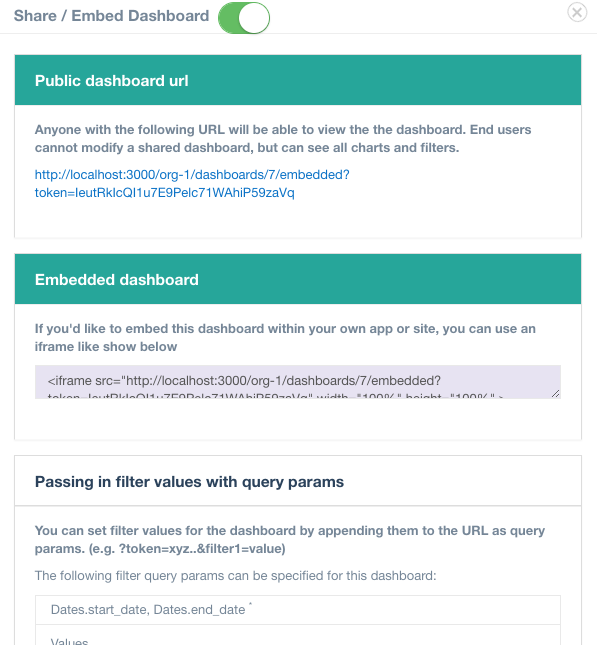
Share your dashboard with a public URL or embed it within your own site or app. [Only available for Large plans]
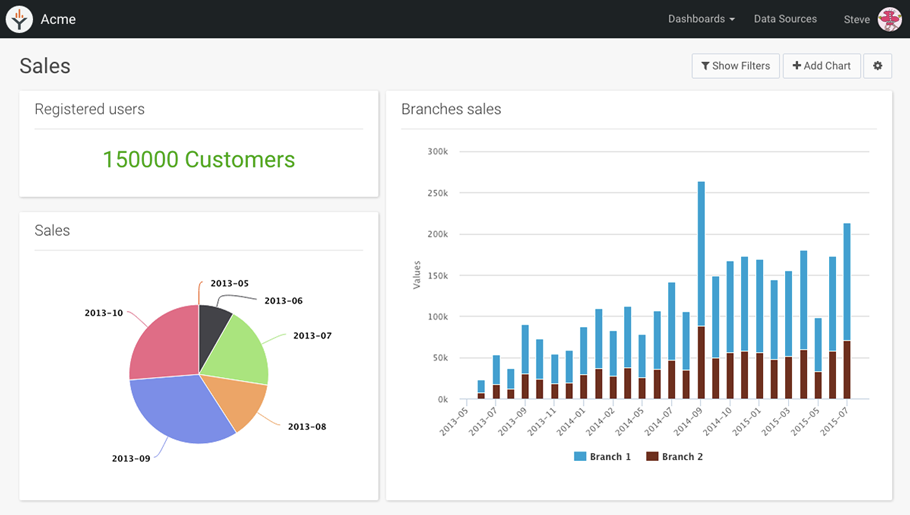
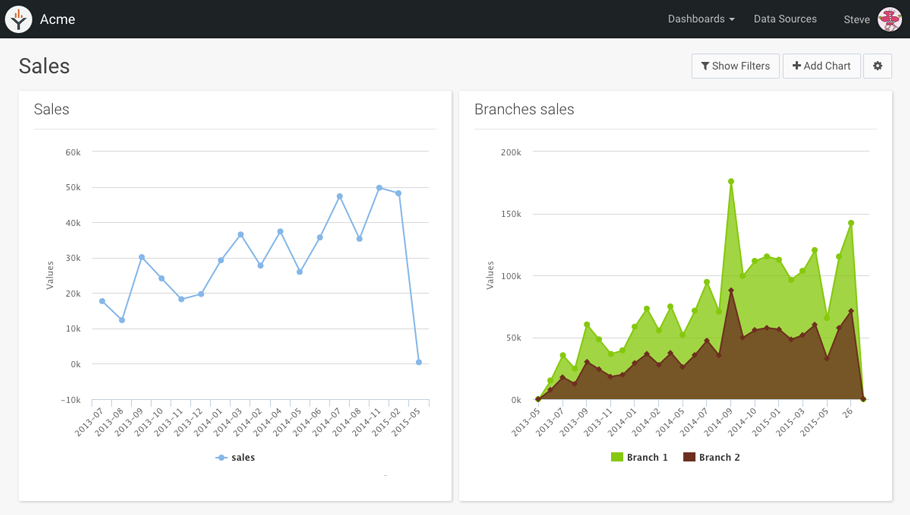
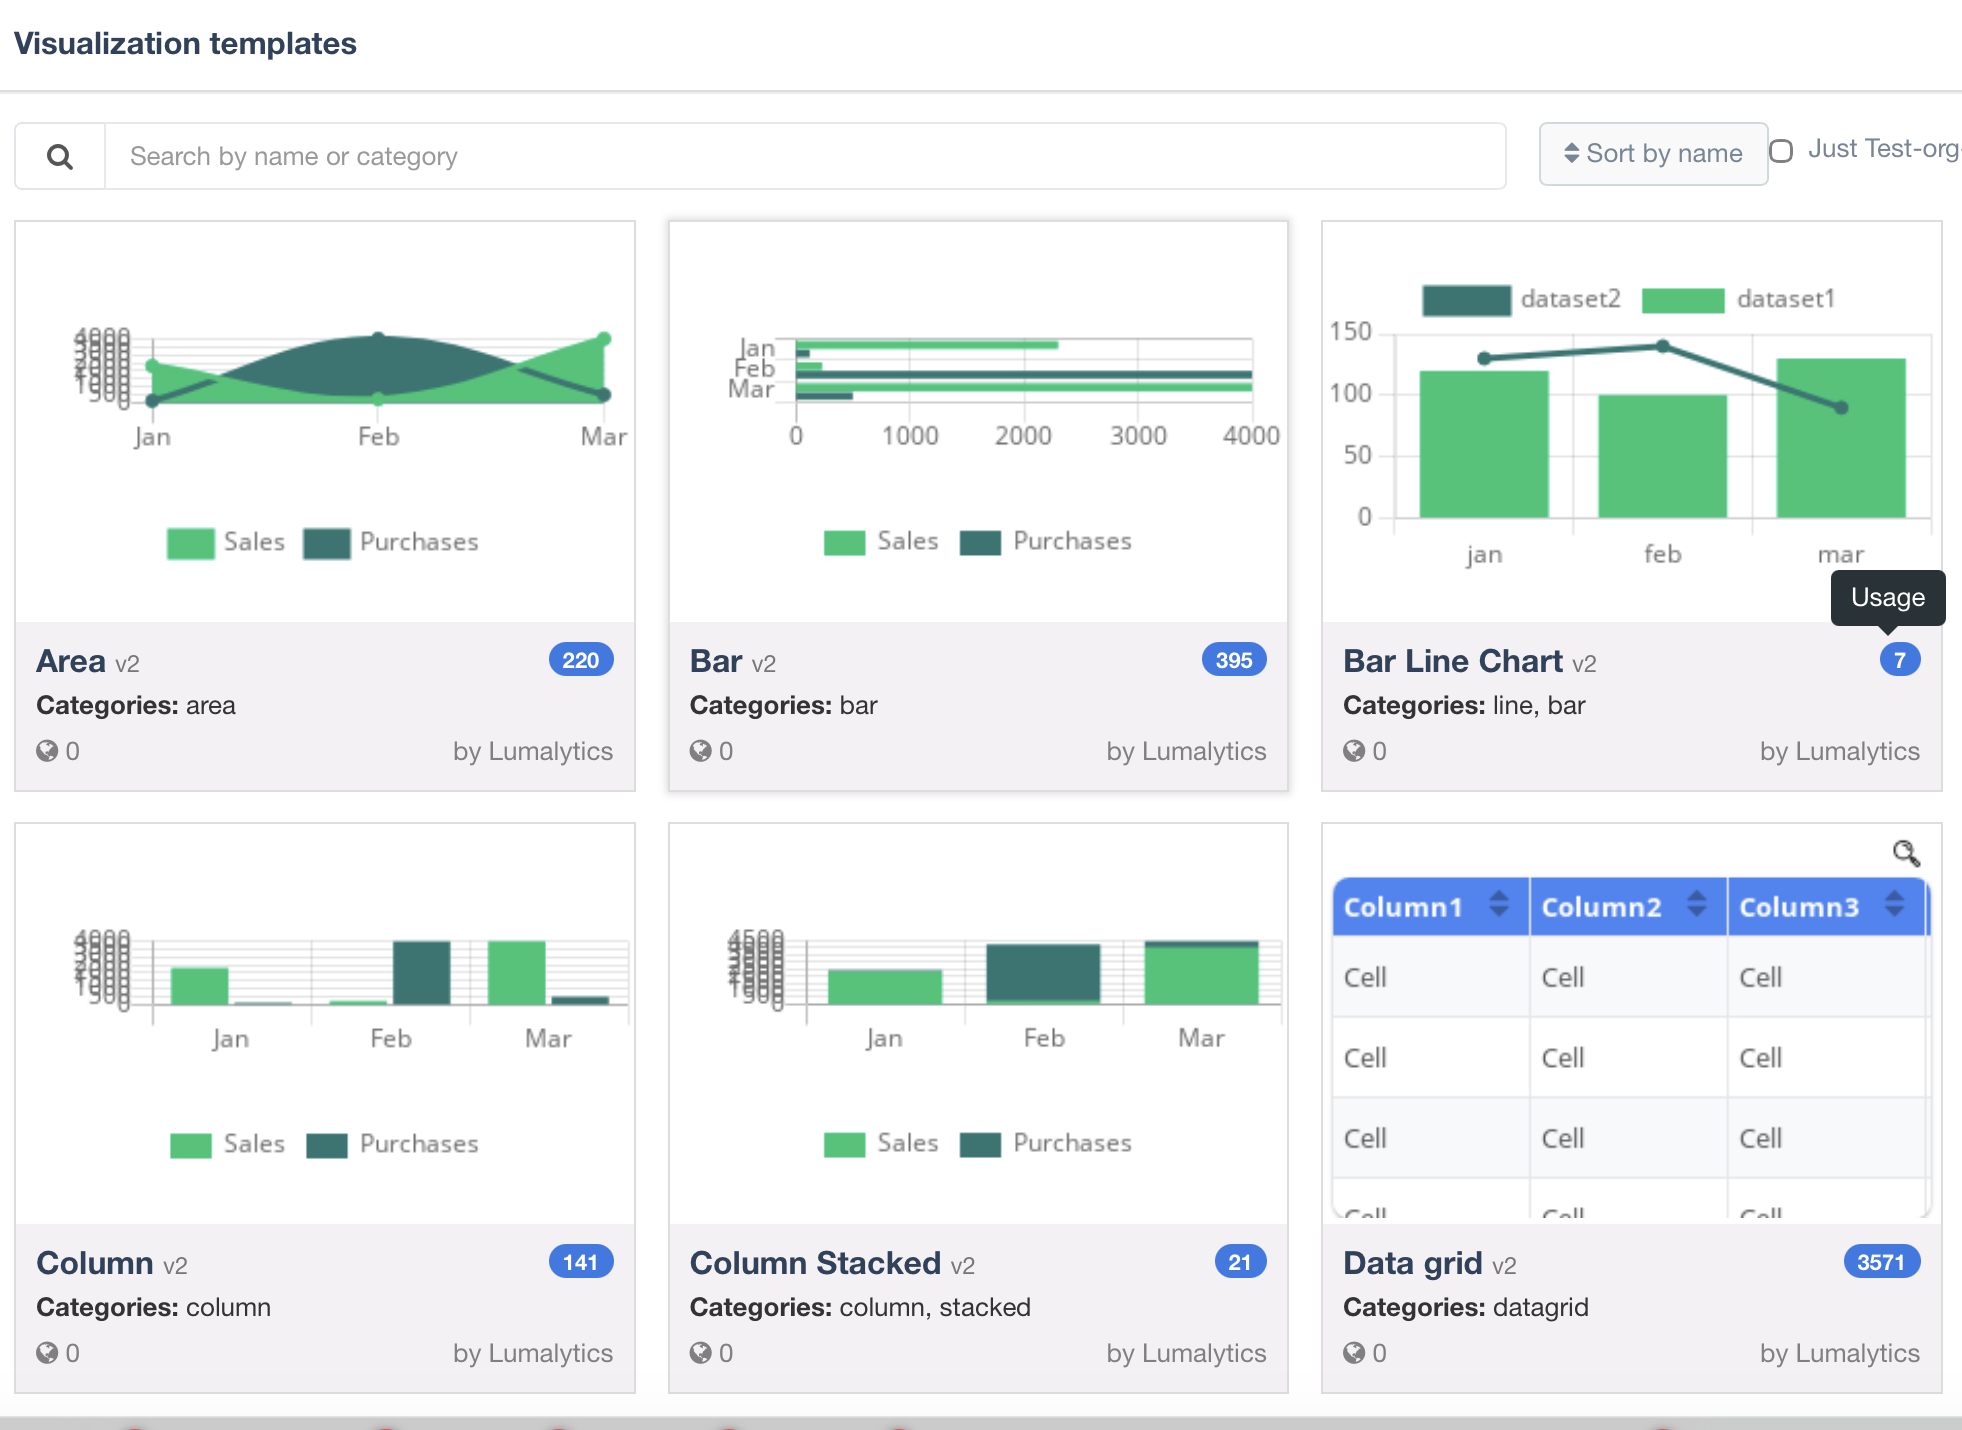
Customize or add any type of chart
You can customize any of the built in charts or add charts from any charting library you'd like (e.g. ChartJS, Apache ECharts, d3.js, etc.).
Pricing
Straightforward pricing for data-centric companies of all sizes.
Try us for free - No credit card required.